Buy Apollo Hospital and Dr Reddy Stocks for Intraday Trading as on 08 January 2024
Intraday trading is a short-term trading strategy that involves buying and selling stocks based on their price movements over a few days or weeks. Swing traders aim to capture the profits from the fluctuations in the market, rather than holding the stocks for long-term growth.
In this article, we will discuss why Apollo Hospital and Dr Reddy stocks are good candidates for swing trading as on 08 January 2024, based on their technical analysis, fundamental analysis, and recent news.
Technical Analysis:
Technical analysis is the study of the price patterns, trends, and indicators of a stock, using historical data and charts. Technical analysis helps to identify the entry and exit points, as well as the potential direction and magnitude of the price movements.
Apollo Hospital:
Apollo Hospital is one of the leading healthcare providers in India, with a network of over 70 hospitals, 4000 pharmacies, and 150 clinics. The stock is listed on the National Stock Exchange of India (NSE) under the symbol APOLLOHOSP.
Also Read - Hot 4 Swing Stocks for 8th January 2024
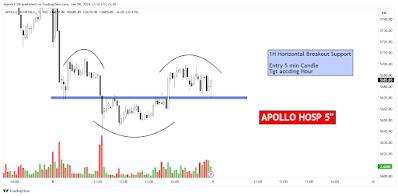
The stock has been in a strong uptrend since November 2023, breaking out of a rectangle box pattern on 27 December 2023, with a volume spike. The stock has also formed a positive reversal in the daily and 1-hour time frames, indicating a continuation of the bullish momentum. The stock is trading above its short, medium, and long-term moving averages, which act as support levels. The stock has also crossed its previous 52-week high of 5839.95 on 05 January 2024, reaching a new all-time high of 5935.40.
Dr Reddy:
Dr Reddy is one of the leading pharmaceutical companies in India, with a presence in over 25 countries. The stock is listed on the NSE under the symbol DRREDDY.
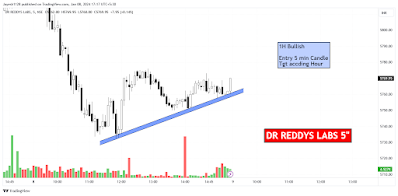
The stock has been in a sideways trend since November 2023, trading in a range of 4800 to 5200. The stock has formed a double bottom pattern on the daily time frame, with a neckline at 5200. The stock has also formed a positive divergence on the RSI, indicating a possible reversal of the bearish trend.
The stock is trading above its short and medium-term moving averages, but below its long-term moving average, which acts as a resistance level. The stock has also crossed its previous 52-week high of 5199.95 on 05 January 2024, reaching a new 52-week high of 5219.95.


